
Key Takeaways
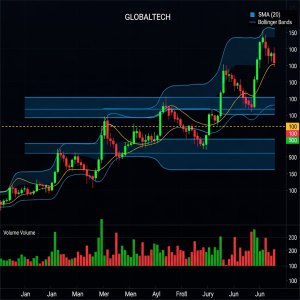
- The Band width indicators show the Bollinger Band boundary distances to help traders identify periods of low market volatility which leads to major price breaks
- TradingView enables users to customize their platform through Pine Script and multi-timeframe analysis but MT4 offers basic standard implementations with restricted flexibility
- The Bollinger Band squeeze develops when market volatility reaches its most reduced state which produces strong opportunities for market direction shifts
- The combination of volume signals with false breakout protection methods becomes essential for achieving lasting success when using band width trading strategies
- The platforms show different real-time data processing abilities which result in delayed alert times and reduced execution performance
- The Band Width indicator helps traders discover concealed breakout possibilities.
- The Band width indicator converts Bollinger Bands into quantitative volatility measurement tools which traders can use for market analysis. The calculation of band distance between upper and lower boundaries enables traders to detect market compression phases which lead to powerful price movements. The band width measurement reaches its most compressed state when it reaches multi-period lows according to John Bollinger who describes this phenomenon as a “squeeze.” The market builds substantial directional breakout potential through its reduced volatility during these periods.
The mathematical basis of this system uses standard deviation calculations which operate from a moving average foundation. The bands decrease in size when price action stays within narrow ranges which results in a smaller band width measurement.
The band width contraction becomes visible through TradingView and MT4 platforms although they use different methods for implementation. The main trading opportunity emerges from understanding that market periods with minimal volatility tend to lead to major volatility increases which create forecastable trading opportunities.
Professional traders track band width percentiles across 100-125 bar periods because Bollinger Band methodology recommends this time frame. The market shows increased potential for substantial price movements when current band width positions within the bottom 10-20% of historical readings. AI Trading Systems research demonstrates that market compression periods which include volume analysis generate some of the most dependable technical analysis trading opportunities.
TradingView provides sophisticated tools for band width detection which advanced traders can use
Pine Script enables traders to develop complex volatility detection systems through its extensive customization options.
The Pine Script language on TradingView enables users to create customized band width analysis through its unrestricted modification capabilities.
Traders can develop complex volatility detection systems through Pine Script because they can combine various standard deviation levels with adaptive period settings and dynamic threshold values.
The Pine Script environment enables users to create complex conditional statements which modify band parameters according to market volatility patterns but MT4 standard indicators lack this capability.
Users who write advanced Pine Script code can select VWAP as their basis line instead of SMA to generate more sensitive band width calculations for markets with strong institutional participation.
The scripting environment enables users to obtain data from different timeframes which allows them to study band width behavior across various market periods simultaneously.
The system generates alerts based on band width reaching particular percentile levels which enables traders to receive exact entry points.
Multiple timeframes enable traders to monitor band width compression through TradingView.
The platform enables users to view daily and 4-hour and hourly band width measurements on one chart which helps them detect areas where different timeframes show synchronized squeeze patterns. The combination of multiple timeframes in analysis leads to better breakout prediction results than studying a single time period.
The request.security() function in TradingView enables users to merge band width data from higher timeframes into their lower-timeframe charts.
The combination of daily band width compression with hourly band width expansion produces strong indications for market breakouts. Trading strategies that professionals use require at least two timeframes to match before starting trades and TradingView provides straightforward access to this analysis.
The TTM Squeeze indicators in popular use show colored dots which indicate squeeze status through orange for compression and green for expansion phases. The indicators use mathematical volatility measurements to establish objective trading rules through their visual signals which eliminate human subjectivity.
The indicators display momentum histograms which help traders identify breakout directions before price movements become visible.
MT4 Bollinger Band Implementation and Its Restrictive Features
Standard Bollinger Bands Parameters (20-Period, 2-Standard Deviation)
The MT4 Bollinger Bands indicator operates with John Bollinger’s original settings which include a 20-period simple moving average and 2.0 standard deviation multipliers.
The standard Bollinger Bands implementation on MT4 delivers dependable volatility data for typical market scenarios although users face restricted customization options when compared to TradingView. The platform determines band width through a calculation that subtracts the lower band from the upper band then divides the result by the middle line to generate a percentage-based volatility indicator.
Users can modify the period setting between 10 and 50 periods and deviation multipliers from 1.5 to 3.0 but these changes need individual instrument and time frame optimization through manual testing.
The standard Bollinger Bands configuration delivers reliable results for major currency pairs and liquid markets yet requires parameter adjustments for exotic instruments which prove difficult to test and optimize through the platform.
Users need to create custom indicators through MQL4 programming to perform advanced band width analysis on MT4 platforms.
Professional users implement Volatility Ratio calculations together with Average True Range (ATR) to improve standard deviation results in their band width analysis. The custom indicators enable users to obtain advanced squeeze detection and breakout confirmation signals.
The programming environment of MT4 lacks the broad range of functions and data management tools which TradingView’s Pine Script provides.
Users need advanced programming skills and extended development time to execute multi-timeframe analysis and build complex conditional logic.
Most traders who use MT4 depend on pre-built indicator sets instead of building their own indicators because they lack the programming skills to create custom solutions.
The two platforms use different methods to calculate band width in their systems.
TradingView uses Pine Script to perform dynamic band width calculations which adjust to market fluctuations.
The standard formula for band width calculation uses (upper_band – lower_band) / basis_line * 100 to produce a percentage value which maintains consistency between different price levels and trading instruments.
The ATR normalization method in advanced Pine Script indicators produces band width values that adjust to instrument-specific characteristics.
The Pine Script indicators use statistical methods to detect squeezes by analyzing historical band width percentiles.
The algorithm produces squeeze alerts when current readings reach below the 20th percentile of the past 125 periods.
The statistical method establishes specific thresholds which outperform fixed values to generate more dependable signals across various market environments.
MT4 performs standard deviation calculations through square root operations on variance measurements. The platform calculates the average of period-specific squared deviations from the moving average before taking the square root to obtain standard deviation values.
The band width appears as a direct numerical value which represents absolute volatility instead of relative volatility.
The calculation approach delivers dependable results for studying individual financial instruments yet produces challenges when users need to evaluate multiple markets with varying price levels.
The 50-pip band width on EUR/USD shows different market volatility levels than the 500-point band width on the S&P 500 index so users need to perform manual adjustments for their portfolio analysis.
The main distinction between these systems stems from their ability to standardize measurements and their ability to adapt.
The percentage-based calculations on TradingView enable users to evaluate different instruments and timeframes through direct comparison but MT4 requires users to perform manual scaling for band width analysis.
The Pine Script environment on TradingView enables users to perform complex statistical operations including percentile movement analysis and automatic threshold value adjustments.
The platform uses established statistical methods to perform calculations through its basic processing system.
The platform generates dependable results for individual instrument analysis but its restricted parameter adjustment capabilities make it unsuitable for handling complex multi-market strategies and dynamic parameter optimization.
Breakout Signal Recognition Strategies
The Bollinger Band Squeeze Setup
The Bollinger Band squeeze stands as one of the most dependable volatility-based entry points in technical market analysis. The band width reaches its smallest point when it reaches multi-period lows which usually happens between 20-50 bars based on market conditions and time frame selection. The squeeze pattern shows that market volatility has reached extreme levels which leads to strong market direction.
The process of identifying effective squeezes involves analyzing current band width against its position in historical percentile rankings instead of using static threshold values. Traders use band width readings in the lowest 10-15% of past data to verify genuine market consolidation instead of short-term trend interruptions. The setup reaches its peak effectiveness when multiple timeframes display identical squeeze patterns.
Volume Confirmation for Sustainable Breakouts
The analysis of volume helps traders identify actual market breaks from short-lived false signals that tend to reverse quickly.
The market shows sustainable breakouts through volume growth that reaches 50% above its previous average level because this indicates major market participants are actively participating. The initial breakout bar should show increasing volume which should continue at elevated levels during the subsequent market direction.
The perfect setup emerges when volume decreases during squeeze periods followed by volume increases that attempt to break out. The accumulation of smart money during consolidation phases leads to institutional market participation which drives the market direction.
The volume analysis tools available on TradingView simplify the confirmation process better than MT4 does because of its restricted volume display features.
False Breakout Prevention Methods
The identification of false breakouts needs multiple verification points which exceed basic band penetration checks. The system requires price to cross the band threshold and maintain a close position that exceeds 25-50% of the band width measurement. The breakout needs to happen with increasing volume while price should move in the desired direction for 1-3 bars.
The system uses time-based filters to stop premature signals by requiring breakout conditions to stay active for multiple bars before generating entry signals.
The successful implementation of this strategy needs band width expansion to continue for 3-5 bars after the initial breakout to prove volatility growth stability.
Platform Performance Comparison for Active Trading
Real-time Data Processing Speed
The cloud-based structure of TradingView provides better real-time data processing capabilities although platform performance depends on multiple elements including network stability and system capacity.
The platform’s server-based system performs complex calculations and handles multiple timeframes while Pine Script indicators maintain smooth updates for all instruments and timeframes.
MT4 operates based on local computer resources and network stability because these elements determine its performance speed.
The platform becomes unresponsive when users run complex custom indicators together with multiple chart settings during periods of high market volatility.
The platform operates with a single processing thread which creates performance delays when users run multiple analytical tools at once.
Alert System Capabilities: Push Notifications vs Pop-up Windows
The alert system of TradingView enables users to receive notifications through email and SMS and webhooks and mobile push notifications.
Traders can establish complex alert systems through TradingView which check for band width percentiles and volume patterns and time-based conditions. The system enables premium subscribers to set up unlimited alerts which allow them to track various trading strategies across different instruments.
The MT4 alert system provides users with audio notifications and email alerts and pop-up windows on the trading platform and mobile notifications through the MT4 mobile application.
The platform requires users to write custom indicators for creating complex multi-condition alerts which restricts most retail traders from using advanced monitoring systems compared to TradingView’s built-in alert system.
Select TradingView for Advanced Volatility Analysis and Customization
TradingView stands out as the superior choice for complex band width volatility analysis because it offers unparalleled customization through Pine Script programming and supports multiple timeframes.
The platform uses percentage-based calculations to enable meaningful comparisons between different instruments and market conditions while its cloud-based infrastructure delivers reliable performance during critical trading times.
The professional trading platform TradingView offers superior analytical capabilities and advanced alert systems and customization options which exceed the standard features of MT4. The platform’s active community together with its extensive indicator library enables users to access additional resources for strategy development and optimization.
The basic Bollinger Band analysis through standard parameters works fine on MT4 but traders who want to use volatility-based strategies will find TradingView’s professional-grade tools more suitable. The premium features of TradingView generate better signal quality and enhanced risk management and detailed market analysis that justify their investment cost.
The AI Trading Systems platform helps traders who want to create complex volatility detection methods through its professional tools and complete customization options.