Posted on Leave a comment

MetaTrader 5 vs cTrader for Bollinger Bands: Performance Comparison Released

Key Takeaways

  • cTrader offers advanced technical analysis features with 54 timeframes compared to MT5’s 21, plus built-in risk calculators and closed market ordering features that benefit Bollinger Band strategies.
  • Platform architecture significantly impacts Bollinger Band performance – MT5’s multi-threaded design excels at handling multiple Expert Advisors simultaneously, while cTrader’s STP/ECN infrastructure can deliver faster order execution with lower fees depending on the broker.
  • Both platforms offer extensive Bollinger Band configuration options, but differ in their approach to algorithmic trading implementation and backtesting capabilities.
  • Trading strategy implementation varies between platforms, with MT5 providing extensive Expert Advisor capabilities and cTrader offering cloud-based cBot execution for 24/7 automated trading.

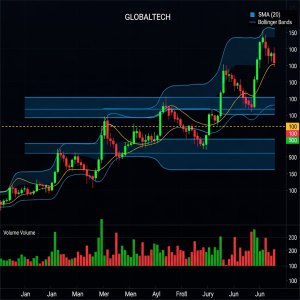
Bollinger Bands, developed by John Bollinger in the early 1980s, are a widely used technical indicator for measuring market volatility and identifying potential trading opportunities. These bands consist of a middle line (typically a 20-day simple moving average), an upper band, and a lower band that adjust dynamically based on price volatility.

Platform Architecture Drives Bollinger Band Performance

The underlying architecture of each trading platform fundamentally shapes how Bollinger Bands function and perform. MT5’s multi-threaded architecture can provide a significant advantage when running multiple indicators and Expert Advisors simultaneously, ensuring smooth performance even with complex Bollinger Band strategies that require real-time calculations across multiple timeframes.

cTrader, with its STP/ECN infrastructure, often delivers faster order execution and lower fees depending on the broker – particularly important for high-frequency Bollinger Band strategies that capitalize on quick price movements near the bands. This architecture proves especially valuable for scalping strategies that rely on rapid band touches and reversals.

The bands widen during high volatility periods and narrow during low volatility, providing visual cues for potential breakouts or consolidations. AI Trading Systems specializes in helping traders optimize these volatility-based strategies across different platform architectures.

1. Standard Settings Available on Both Platforms

Both MT5 and cTrader provide extensive Bollinger Band configuration options, though their implementation differs significantly. The standard 20-period simple moving average with 2 standard deviation bands remains consistent across both platforms, but customization capabilities vary.

MT5 offers extensive parameter modification through its built-in indicator settings, allowing traders to adjust period length, deviation multipliers, and apply the bands to different price types (close, open, high, low). The platform’s strength lies in its ability to save custom indicator templates and apply them across multiple charts simultaneously.

cTrader provides similar customization options with its risk calculator integration that allows traders to automatically adjust position sizes based on Bollinger Band width, creating more sophisticated risk management strategies that adapt to current market volatility.

2. Timeframe Options and Flexibility

The difference in available timeframes creates significant strategic advantages for different trading styles. MT5’s 21 timeframes cover most standard trading periods, from M1 (1-minute) to MN1 (monthly), providing adequate coverage for most Bollinger Band strategies.

cTrader’s 54 timeframes offer greater granularity, including unique periods like 2-minute, 3-minute, and 7-minute charts that can reveal Bollinger Band patterns invisible on standard timeframes. This flexibility proves particularly valuable for intraday traders who need to fine-tune their entry and exit points based on band interactions at specific time intervals.

The additional timeframes in cTrader enable more sophisticated multi-timeframe analysis, where traders can simultaneously monitor Bollinger Band squeezes on shorter timeframes while confirming overall trend direction on longer periods. This approach significantly improves the accuracy of breakout predictions and reduces false signals.

3. Custom Indicator Integration Capabilities

MT5’s large developer community provides access to thousands of custom Bollinger Band variations through the MQL5 Market. These include enhanced versions with additional features like dynamic period adjustment, multi-timeframe overlays, and integration with other technical indicators for confluence trading.

The cTrader Store offers curated Bollinger Band-related cBots and indicators, aiming for higher quality and better integration with the platform’s core functionality. This curated approach reduces the trial-and-error process often required when using third-party MT5 indicators.

Execution Speed and Order Processing

MT5’s Multi-Threaded Architecture Benefits

MT5’s multi-threaded architecture can deliver exceptional performance when executing complex Bollinger Band strategies that require simultaneous monitoring of multiple currency pairs or timeframes. The platform can handle dozens of Expert Advisors running Bollinger Band calculations without performance degradation, making it ideal for professional trading setups.

This architecture particularly benefits algorithmic traders who implement sophisticated Bollinger Band strategies involving statistical arbitrage or correlation trading. The platform’s ability to process real-time tick data across multiple instruments ensures that band calculations remain accurate even during high-volatility periods when rapid price movements could affect indicator reliability.

The multi-threading capability also enables advanced backtesting scenarios where traders can test Bollinger Band strategies across multiple currency pairs simultaneously, providing more detailed performance data and reducing the time required for strategy optimization.

cTrader’s Broker-Dependent Execution Models

cTrader’s execution speed depends heavily on the broker’s infrastructure; however, the platform’s STP/ECN design can often deliver superior execution for active Bollinger Band traders. The direct market access eliminates dealing desk delays that could cause slippage during critical band touch moments.

The platform’s closed market order feature can provide an advantage for Bollinger Band strategies. Traders can place orders that activate only when specific band conditions are met, even when markets are closed, ensuring they don’t miss opportunities during overnight sessions or weekend gaps.

Order execution transparency in cTrader allows traders to see exactly how their Bollinger Band-triggered orders are filled, including access to Level II market data that reveals the depth behind significant band levels. This information proves valuable for understanding whether band touches represent genuine support/resistance or simply temporary liquidity imbalances.

Bollinger Band Trading Strategy Implementation

1. Bollinger Bounce Strategy Setup

The Bollinger Bounce strategy capitalizes on mean reversion principles, assuming that prices touching the outer bands will bounce back toward the moving average. MT5’s Expert Advisor capabilities excel at automating this strategy through sophisticated entry and exit criteria that account for multiple confirmation signals.

MT5 allows traders to program complex Bollinger Bounce algorithms that incorporate additional filters like RSI divergence, volume confirmation, or support/resistance levels. The platform’s optimization tools can backtest thousands of parameter combinations to find the most profitable settings for specific market conditions.

cTrader’s advanced charting tools make it easier to identify high-probability bounce scenarios, while the integrated risk management tools automatically calculate optimal position sizes based on the distance between entry point and middle band.

2. Squeeze Pattern Detection

Bollinger Band squeezes indicate periods of low volatility that often precede significant price movements. Both platforms handle squeeze detection differently, with MT5 offering more automated detection through custom indicators and cTrader providing superior visual identification tools.

MT5’s custom indicators can automatically identify squeeze conditions by calculating the relationship between band width and historical volatility. These indicators can trigger alerts or automatically place pending orders in anticipation of the eventual breakout, removing the need for constant chart monitoring.

cTrader’s 54 timeframes enable traders to identify squeeze patterns across multiple time horizons simultaneously. A squeeze visible on a 15-minute chart might coincide with a broader consolidation pattern on a 4-hour chart, providing stronger conviction for the eventual breakout direction and magnitude.

3. Volatility Breakout Identification

Successful volatility breakout trading requires precise timing and reliable execution – areas where both platforms demonstrate distinct strengths. MT5’s backtesting capabilities allow traders to optimize breakout parameters using real tick data, which can improve strategy performance across different market conditions.

The platform’s multi-currency testing capabilities enable traders to identify which currency pairs historically produce the most reliable Bollinger Band breakouts, allowing for more focused strategy deployment. This data-driven approach significantly improves the success rate of volatility breakout strategies.

cTrader’s real-time execution can be advantageous during volatile breakout scenarios, depending on the broker. The platform’s direct market access ensures that breakout orders are filled at the best available prices without dealing desk intervention, reducing the slippage that can turn profitable breakout setups into marginal trades.

Algorithmic Trading and Backtesting Features

MT5’s Expert Advisor Capabilities

MT5’s Expert Advisor framework provides significant flexibility for implementing sophisticated Bollinger Band strategies. The MQL5 programming language allows traders to create complex algorithms that incorporate multiple timeframes, currency pairs, and confirmation indicators within a single automated system.

The platform’s backtesting engine supports multi-currency strategies with real tick data, providing detailed metrics that help traders understand how their Bollinger Band strategies perform across different market conditions. The ability to test strategies using actual historical spreads and commission structures ensures more realistic performance projections.

MT5’s optimization features enable traders to find optimal parameter combinations for their Bollinger Band strategies through genetic algorithms and mathematical optimization techniques. This scientific approach to strategy development significantly improves the likelihood of consistent profits across varying market conditions.

cTrader’s Cloud-Based cBot Execution

cTrader’s cloud-based cBot execution offers a different approach to algorithmic trading, allowing Bollinger Band strategies to run 24/7 without requiring a local computer or VPS. This infrastructure lowers the technical barriers that often prevent traders from implementing automated strategies effectively.

The platform offers free algo hosting for basic strategies, making algorithmic Bollinger Band trading accessible to retail traders who might not have the resources for dedicated hosting solutions. This democratization of algorithmic trading levels the playing field between retail and institutional traders.

cTrader’s backtesting capabilities prioritize accuracy, aiming to ensure that Bollinger Band strategy performance data reflects real trading conditions. The platform’s backtesting engine accounts for realistic spreads, commissions, and slippage, providing more reliable performance projections for live trading implementation.

Platform Comparison Summary

Both platforms offer robust Bollinger Band implementation capabilities with distinct advantages. cTrader’s 54 timeframes provide unmatched granularity for identifying optimal entry and exit points, while the STP/ECN infrastructure can ensure that orders are executed at competitive prices during critical band interactions, depending on the broker.

cTrader’s integrated risk management tools automatically adjust position sizes based on current Bollinger Band width, creating dynamic risk management that adapts to changing market volatility. This feature alone can significantly improve long-term trading performance by reducing position sizes during high-volatility periods and increasing them during stable conditions.

The platform’s cloud-based cBot execution lowers the technical barriers that often prevent traders from implementing sophisticated Bollinger Band strategies, while the closed market order feature ensures that opportunities aren’t missed during off-hours trading sessions.

MT5 excels in backtesting capabilities and Expert Advisor flexibility, making it suitable for traders who prioritize strategy development and optimization. The platform’s multi-threaded architecture handles complex multi-instrument strategies effectively.

Learn more about advanced Bollinger Band strategies and platform optimization techniques with AI Trading Systems, where cutting-edge algorithmic trading solutions meet practical market expertise.

Posted on Leave a comment

ThinkorSwim vs NinjaTrader for Bollinger Band Configuration Tools

Key Takeaways

  • ThinkorSwim’s ThinkScript allows custom Bollinger Band indicator development and short entry signal creation
  • NinjaTrader offers specialized Double Bollinger Bands for enhanced trend identification using dual standard deviations
  • ThinkorSwim excels in multi-asset trading while NinjaTrader specializes in futures market analysis
  • Both platforms provide extensive parameter customization, but their automated trading integration differs significantly
  • The right platform choice depends on whether traders prioritize custom scripting or pre-built advanced band configurations

Professional traders using Bollinger Bands face a critical decision when choosing between ThinkorSwim and NinjaTrader platforms. Both offer sophisticated technical analysis capabilities, but their Bollinger Band configuration tools differ substantially in approach, customization options, and specialized features that can impact trading outcomes.

Key Configuration Differences Impact Your Trading Strategy

The fundamental difference between these platforms lies in their approach to Bollinger Band customization and implementation. ThinkorSwim emphasizes custom development through its ThinkScript programming language, allowing traders to build personalized indicators from scratch. NinjaTrader focuses on providing advanced pre-built configurations like Double Bollinger Bands that enhance traditional strategies, though some advanced customizations may still require programming knowledge.

Both platforms allow standard parameter adjustments including period settings, standard deviation multipliers, and moving average types. However, the depth of customization and ease of implementation varies considerably. ThinkorSwim requires scripting knowledge for advanced features, while NinjaTrader offers sophisticated configurations through its user-friendly interface.


ThinkorSwim’s Bollinger Band Features

1. Custom Short Entry Signal Creation via ThinkScript

ThinkorSwim enables traders to create custom Bollinger Band strategies through ThinkScript, including short entry signals that trigger when price crosses below the upper band. These custom-built strategies demonstrate the platform’s capability to create actionable trading signals directly from Bollinger Band movements. Traders can modify these signals using ThinkScript to incorporate additional confirmation criteria or adjust trigger conditions based on market volatility.

The short entry signals integrate seamlessly with ThinkorSwim’s order management system, enabling automatic trade execution when specific band conditions are met. These automated signal capabilities can significantly reduce the time between signal identification and trade execution.

2. ThinkScript Custom Indicator Development

ThinkScript enables traders to create completely customized Bollinger Band variations that go beyond standard configurations. Users can develop indicators that combine Bollinger Bands with other technical analysis tools, create multi-timeframe band analysis, or implement complex mathematical modifications to the traditional formula. This programming flexibility allows experienced traders to test unique hypotheses and develop proprietary trading strategies.

The custom indicator development process includes backtesting capabilities, enabling traders to validate their modified Bollinger Band strategies against historical data before implementing them in live markets. Advanced users can create indicators that dynamically adjust band parameters based on market conditions or volatility measurements.

3. Integrated Drawing Tools for Band Analysis

ThinkorSwim’s drawing tools complement Bollinger Band analysis by enabling traders to identify trends, support, and resistance levels in conjunction with band signals. The platform includes trendlines, Fibonacci retracements, and other analytical tools that help confirm Bollinger Band breakouts or reversals.

These drawing tools integrate with Bollinger Band strategies to create analytical frameworks. Traders can mark significant band touches, identify recurring patterns, and visualize the relationship between price action and band boundaries across different timeframes.

NinjaTrader’s Advanced Band Options

1. Double Bollinger Bands for Strong Trend Identification

NinjaTrader’s Double Bollinger Bands indicator represents a significant advancement over traditional single-band configurations. This tool uses two sets of bands with different standard deviations to identify trend strength and direction more accurately. The inner bands typically use 1.5 standard deviations while outer bands use 2.5 standard deviations, creating multiple decision zones for trade entry and exit.

The dual-band approach helps traders distinguish between minor price fluctuations and significant trend changes. When price moves between the inner and outer bands, it suggests moderate trend strength, while movement beyond the outer bands indicates exceptional momentum that may continue or reverse sharply.

2. Technical Indicator Library

NinjaTrader provides over 100 pre-built technical indicators that can be combined with Bollinger Bands for enhanced analysis. These indicators can be layered onto charts without programming knowledge, enabling traders to create sophisticated analytical frameworks quickly. The platform’s indicator library includes momentum oscillators, volume analysis tools, and trend identification indicators that complement Bollinger Band signals.

The extensive indicator collection allows traders to confirm Bollinger Band signals using multiple analytical approaches. For example, combining Bollinger Bands with RSI and volume indicators can help validate potential reversal signals when price touches the outer bands.

3. NinjaScript Automated Trading Integration

NinjaTrader’s NinjaScript technology enables automated trading strategies that execute trades based on Bollinger Band conditions without manual intervention. These automated strategies can monitor multiple markets simultaneously, execute complex multi-leg orders, and implement sophisticated risk management rules based on band positions.

The automated trading integration includes advanced order types like bracket orders, trailing stops, and profit targets that activate automatically when Bollinger Band conditions are met. This capability is particularly valuable for traders who cannot monitor markets continuously but want to capitalize on band-based trading opportunities.

Platform Access and Market Coverage

ThinkorSwim Multi-Asset Trading

ThinkorSwim provides access to stocks, ETFs, options, futures, and forex markets, making it suitable for traders who use Bollinger Bands across different asset classes. The platform offers 24/5 trading for over 1,100 stocks and ETFs, enabling extended-hours Bollinger Band analysis and trading opportunities.

The multi-asset capability allows traders to apply consistent Bollinger Band strategies across various markets while adapting parameters for different asset volatility characteristics. Currency pairs, commodity futures, and equity markets each respond differently to Bollinger Band signals, and ThinkorSwim’s broad market access enables comparative analysis across asset classes.

NinjaTrader’s Futures Trading Specialization

NinjaTrader specializes in futures trading with access to major exchanges including CME Group, Eurex, Coinbase Derivatives, and ICE. This specialization provides deep market access for futures-focused Bollinger Band strategies, including popular contracts like E-mini S&P 500, crude oil, and agricultural commodities, with tools and services specifically tailored for futures traders.

The futures specialization includes features like $50 intraday margins for Micro contracts and $500 for E-Minis, with no deposit minimums, making it accessible for smaller accounts to implement Bollinger Band strategies in leveraged markets. The platform’s futures focus enables optimization of band parameters specifically for commodity and index futures volatility patterns.

Parameter Customization Capabilities

Both platforms allow extensive Bollinger Band parameter customization, but their approaches differ significantly. ThinkorSwim requires ThinkScript knowledge for advanced modifications, while NinjaTrader provides user-friendly interfaces for parameter adjustments. Standard customizations include period length (typically 20), standard deviation multipliers (usually 2.0), and moving average type selection.

Advanced parameter customization includes dynamic period adjustments based on volatility, adaptive standard deviation calculations, and multi-timeframe band analysis. ThinkorSwim excels in creating completely custom parameter algorithms, while NinjaTrader offers sophisticated pre-built parameter options that don’t require programming expertise.

The parameter customization capabilities extend to visual presentation, with both platforms allowing color coding, line thickness adjustments, and transparency settings that help traders quickly identify band conditions across multiple charts and timeframes.

Choose Based on Your Bollinger Band Trading Style

The choice between ThinkorSwim and NinjaTrader depends primarily on trading style, programming ability, and market focus. ThinkorSwim suits traders who want maximum customization flexibility and are comfortable with scripting languages, while NinjaTrader appeals to those who prefer powerful pre-built tools without programming requirements.

Futures traders often gravitate toward NinjaTrader’s specialized features and low margin requirements, while multi-asset traders may prefer ThinkorSwim’s broader market access. Both platforms offer robust Bollinger Band capabilities, but their implementation philosophies cater to different trader preferences and skill levels.

Consider ThinkorSwim for custom indicator development, multi-asset trading, and drawing tool integration. Choose NinjaTrader for advanced pre-built band configurations, futures specialization, and streamlined automated trading implementation.

For guidance on selecting the optimal trading platform for your Bollinger Band strategies, visit AI Trading Systems where analysis helps traders make informed platform decisions.

Posted on Leave a comment

TradingView vs MT4: Band Width Volatility Detection for Breakout Signals

Key Takeaways

  • The Band width indicators show the Bollinger Band boundary distances to help traders identify periods of low market volatility which leads to major price breaks
  • TradingView enables users to customize their platform through Pine Script and multi-timeframe analysis but MT4 offers basic standard implementations with restricted flexibility
  • The Bollinger Band squeeze develops when market volatility reaches its most reduced state which produces strong opportunities for market direction shifts
  • The combination of volume signals with false breakout protection methods becomes essential for achieving lasting success when using band width trading strategies
  • The platforms show different real-time data processing abilities which result in delayed alert times and reduced execution performance
  • The Band Width indicator helps traders discover concealed breakout possibilities.
  • The Band width indicator converts Bollinger Bands into quantitative volatility measurement tools which traders can use for market analysis. The calculation of band distance between upper and lower boundaries enables traders to detect market compression phases which lead to powerful price movements. The band width measurement reaches its most compressed state when it reaches multi-period lows according to John Bollinger who describes this phenomenon as a “squeeze.” The market builds substantial directional breakout potential through its reduced volatility during these periods.

The mathematical basis of this system uses standard deviation calculations which operate from a moving average foundation. The bands decrease in size when price action stays within narrow ranges which results in a smaller band width measurement. 

The band width contraction becomes visible through TradingView and MT4 platforms although they use different methods for implementation. The main trading opportunity emerges from understanding that market periods with minimal volatility tend to lead to major volatility increases which create forecastable trading opportunities.

Professional traders track band width percentiles across 100-125 bar periods because Bollinger Band methodology recommends this time frame. The market shows increased potential for substantial price movements when current band width positions within the bottom 10-20% of historical readings. AI Trading Systems research demonstrates that market compression periods which include volume analysis generate some of the most dependable technical analysis trading opportunities.

TradingView provides sophisticated tools for band width detection which advanced traders can use


Pine Script enables traders to develop complex volatility detection systems through its extensive customization options.

The Pine Script language on TradingView enables users to create customized band width analysis through its unrestricted modification capabilities.

Traders can develop complex volatility detection systems through Pine Script because they can combine various standard deviation levels with adaptive period settings and dynamic threshold values.

The Pine Script environment enables users to create complex conditional statements which modify band parameters according to market volatility patterns but MT4 standard indicators lack this capability.

Users who write advanced Pine Script code can select VWAP as their basis line instead of SMA to generate more sensitive band width calculations for markets with strong institutional participation.

The scripting environment enables users to obtain data from different timeframes which allows them to study band width behavior across various market periods simultaneously.

The system generates alerts based on band width reaching particular percentile levels which enables traders to receive exact entry points.

Multiple timeframes enable traders to monitor band width compression through TradingView.

The platform enables users to view daily and 4-hour and hourly band width measurements on one chart which helps them detect areas where different timeframes show synchronized squeeze patterns. The combination of multiple timeframes in analysis leads to better breakout prediction results than studying a single time period.

The request.security() function in TradingView enables users to merge band width data from higher timeframes into their lower-timeframe charts.

The combination of daily band width compression with hourly band width expansion produces strong indications for market breakouts. Trading strategies that professionals use require at least two timeframes to match before starting trades and TradingView provides straightforward access to this analysis.

The TTM Squeeze indicators in popular use show colored dots which indicate squeeze status through orange for compression and green for expansion phases. The indicators use mathematical volatility measurements to establish objective trading rules through their visual signals which eliminate human subjectivity.

The indicators display momentum histograms which help traders identify breakout directions before price movements become visible.

MT4 Bollinger Band Implementation and Its Restrictive Features

Standard Bollinger Bands Parameters (20-Period, 2-Standard Deviation)
The MT4 Bollinger Bands indicator operates with John Bollinger’s original settings which include a 20-period simple moving average and 2.0 standard deviation multipliers.

The standard Bollinger Bands implementation on MT4 delivers dependable volatility data for typical market scenarios although users face restricted customization options when compared to TradingView. The platform determines band width through a calculation that subtracts the lower band from the upper band then divides the result by the middle line to generate a percentage-based volatility indicator.

Users can modify the period setting between 10 and 50 periods and deviation multipliers from 1.5 to 3.0 but these changes need individual instrument and time frame optimization through manual testing.

The standard Bollinger Bands configuration delivers reliable results for major currency pairs and liquid markets yet requires parameter adjustments for exotic instruments which prove difficult to test and optimize through the platform.

Users need to create custom indicators through MQL4 programming to perform advanced band width analysis on MT4 platforms.

Professional users implement Volatility Ratio calculations together with Average True Range (ATR) to improve standard deviation results in their band width analysis. The custom indicators enable users to obtain advanced squeeze detection and breakout confirmation signals.

The programming environment of MT4 lacks the broad range of functions and data management tools which TradingView’s Pine Script provides.

Users need advanced programming skills and extended development time to execute multi-timeframe analysis and build complex conditional logic.

Most traders who use MT4 depend on pre-built indicator sets instead of building their own indicators because they lack the programming skills to create custom solutions.

The two platforms use different methods to calculate band width in their systems.

TradingView uses Pine Script to perform dynamic band width calculations which adjust to market fluctuations.

The standard formula for band width calculation uses (upper_band – lower_band) / basis_line * 100 to produce a percentage value which maintains consistency between different price levels and trading instruments.

The ATR normalization method in advanced Pine Script indicators produces band width values that adjust to instrument-specific characteristics.

The Pine Script indicators use statistical methods to detect squeezes by analyzing historical band width percentiles.

The algorithm produces squeeze alerts when current readings reach below the 20th percentile of the past 125 periods.

The statistical method establishes specific thresholds which outperform fixed values to generate more dependable signals across various market environments.

MT4 performs standard deviation calculations through square root operations on variance measurements. The platform calculates the average of period-specific squared deviations from the moving average before taking the square root to obtain standard deviation values.

The band width appears as a direct numerical value which represents absolute volatility instead of relative volatility.

The calculation approach delivers dependable results for studying individual financial instruments yet produces challenges when users need to evaluate multiple markets with varying price levels.

The 50-pip band width on EUR/USD shows different market volatility levels than the 500-point band width on the S&P 500 index so users need to perform manual adjustments for their portfolio analysis.

The main distinction between these systems stems from their ability to standardize measurements and their ability to adapt.

The percentage-based calculations on TradingView enable users to evaluate different instruments and timeframes through direct comparison but MT4 requires users to perform manual scaling for band width analysis.

The Pine Script environment on TradingView enables users to perform complex statistical operations including percentile movement analysis and automatic threshold value adjustments.

The platform uses established statistical methods to perform calculations through its basic processing system.

The platform generates dependable results for individual instrument analysis but its restricted parameter adjustment capabilities make it unsuitable for handling complex multi-market strategies and dynamic parameter optimization.

Breakout Signal Recognition Strategies

The Bollinger Band Squeeze Setup

The Bollinger Band squeeze stands as one of the most dependable volatility-based entry points in technical market analysis. The band width reaches its smallest point when it reaches multi-period lows which usually happens between 20-50 bars based on market conditions and time frame selection. The squeeze pattern shows that market volatility has reached extreme levels which leads to strong market direction.

The process of identifying effective squeezes involves analyzing current band width against its position in historical percentile rankings instead of using static threshold values. Traders use band width readings in the lowest 10-15% of past data to verify genuine market consolidation instead of short-term trend interruptions. The setup reaches its peak effectiveness when multiple timeframes display identical squeeze patterns. 

Volume Confirmation for Sustainable Breakouts

The analysis of volume helps traders identify actual market breaks from short-lived false signals that tend to reverse quickly.

The market shows sustainable breakouts through volume growth that reaches 50% above its previous average level because this indicates major market participants are actively participating. The initial breakout bar should show increasing volume which should continue at elevated levels during the subsequent market direction.

The perfect setup emerges when volume decreases during squeeze periods followed by volume increases that attempt to break out. The accumulation of smart money during consolidation phases leads to institutional market participation which drives the market direction.

The volume analysis tools available on TradingView simplify the confirmation process better than MT4 does because of its restricted volume display features.

False Breakout Prevention Methods

The identification of false breakouts needs multiple verification points which exceed basic band penetration checks. The system requires price to cross the band threshold and maintain a close position that exceeds 25-50% of the band width measurement. The breakout needs to happen with increasing volume while price should move in the desired direction for 1-3 bars.

The system uses time-based filters to stop premature signals by requiring breakout conditions to stay active for multiple bars before generating entry signals.

The successful implementation of this strategy needs band width expansion to continue for 3-5 bars after the initial breakout to prove volatility growth stability. 


Platform Performance Comparison for Active Trading

Real-time Data Processing Speed

The cloud-based structure of TradingView provides better real-time data processing capabilities although platform performance depends on multiple elements including network stability and system capacity.

The platform’s server-based system performs complex calculations and handles multiple timeframes while Pine Script indicators maintain smooth updates for all instruments and timeframes.

MT4 operates based on local computer resources and network stability because these elements determine its performance speed.

The platform becomes unresponsive when users run complex custom indicators together with multiple chart settings during periods of high market volatility.

The platform operates with a single processing thread which creates performance delays when users run multiple analytical tools at once.

Alert System Capabilities: Push Notifications vs Pop-up Windows

The alert system of TradingView enables users to receive notifications through email and SMS and webhooks and mobile push notifications.

Traders can establish complex alert systems through TradingView which check for band width percentiles and volume patterns and time-based conditions. The system enables premium subscribers to set up unlimited alerts which allow them to track various trading strategies across different instruments.

The MT4 alert system provides users with audio notifications and email alerts and pop-up windows on the trading platform and mobile notifications through the MT4 mobile application.

The platform requires users to write custom indicators for creating complex multi-condition alerts which restricts most retail traders from using advanced monitoring systems compared to TradingView’s built-in alert system.

Select TradingView for Advanced Volatility Analysis and Customization


TradingView stands out as the superior choice for complex band width volatility analysis because it offers unparalleled customization through Pine Script programming and supports multiple timeframes.

The platform uses percentage-based calculations to enable meaningful comparisons between different instruments and market conditions while its cloud-based infrastructure delivers reliable performance during critical trading times.

The professional trading platform TradingView offers superior analytical capabilities and advanced alert systems and customization options which exceed the standard features of MT4. The platform’s active community together with its extensive indicator library enables users to access additional resources for strategy development and optimization.

The basic Bollinger Band analysis through standard parameters works fine on MT4 but traders who want to use volatility-based strategies will find TradingView’s professional-grade tools more suitable. The premium features of TradingView generate better signal quality and enhanced risk management and detailed market analysis that justify their investment cost.

The AI Trading Systems platform helps traders who want to create complex volatility detection methods through its professional tools and complete customization options.